Reading the Today screen
The answer at the top
Today is built to answer one question fast: where am I right now? Each active medication gets its own card showing your current active mg — how much the model estimates is still working in you — alongside an estimated blood concentration in ng/mL and a status chip against your steady-state band: Below band, In range, or above it. Anything still active but lower-priority tucks under an Other active row you can expand.
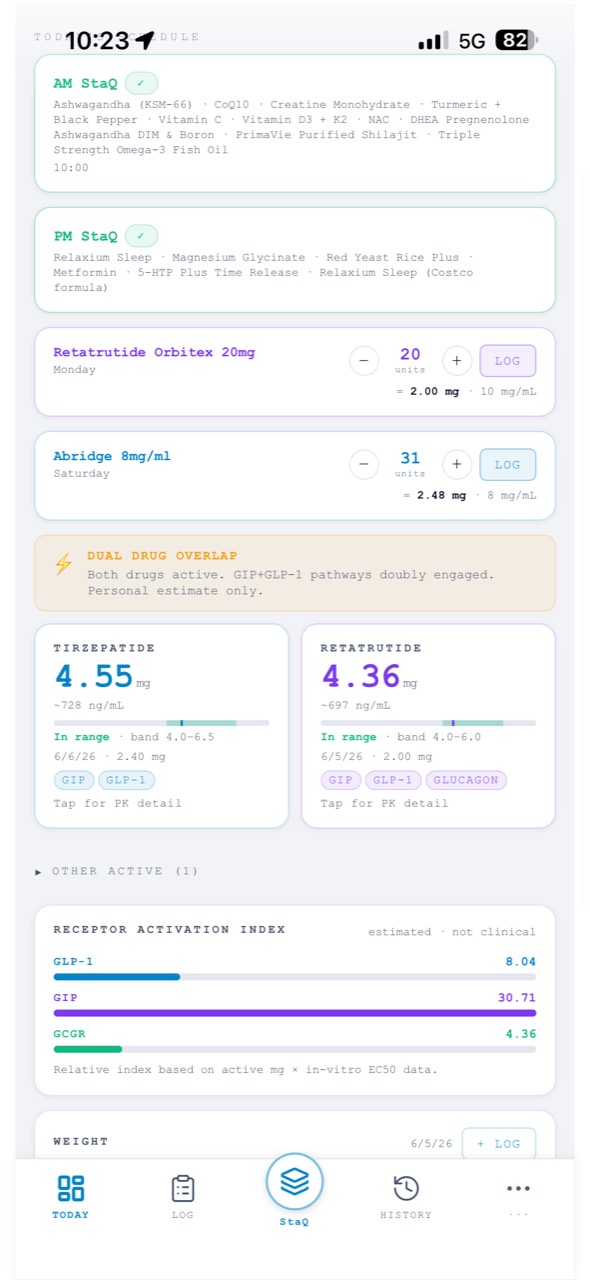
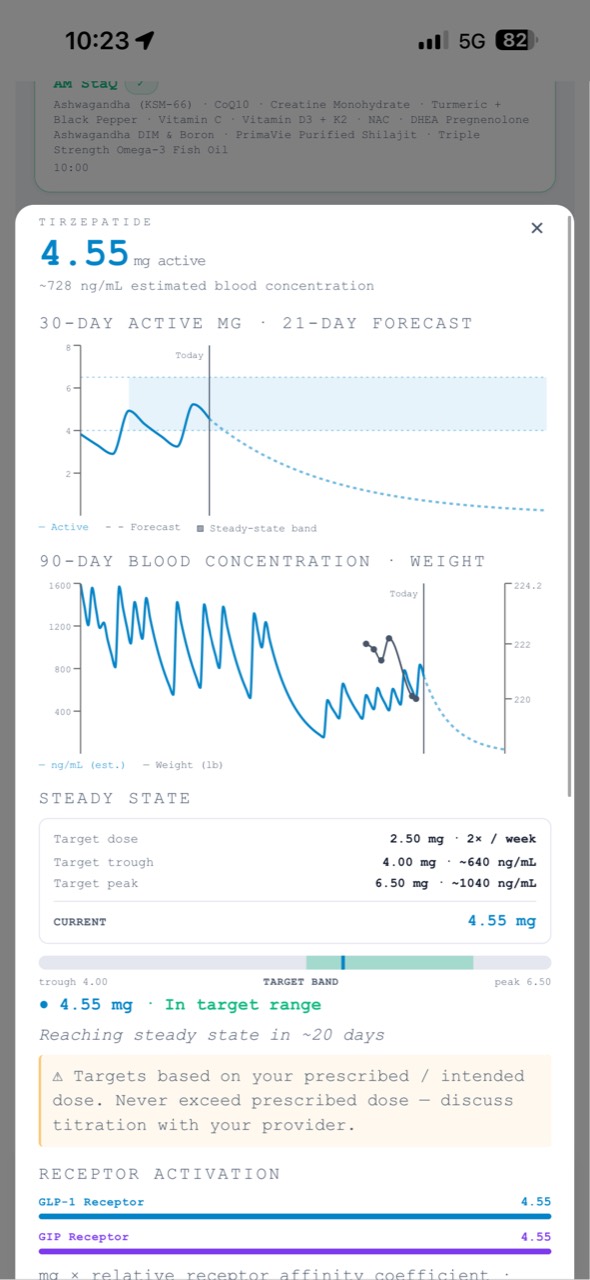
Tap any card for the full PK detail — the exposure chart, your target dose, and the trough-to-peak target band.
When more than one medication is active
If two things are working at once, StaQ surfaces a Dual Drug Overlap note at the top — for example, two incretins both engaging the GIP and GLP-1 pathways. It's a personal estimate that the combination is what your body is actually experiencing, not a safety judgment or a recommendation. More on overlap flags →
Receptor activation
For multi-pathway medications, StaQ shows a Receptor Activation Index across GLP-1, GIP, and GCGR. It's a relative index — your active mg scaled by each drug's published in-vitro receptor affinity — meant to show how a regimen distributes across pathways, which is useful when comparing medications in your history.
It is labeled estimated · not clinical for a reason: it is not a measurement of what's happening at your receptors, and the numbers are unitless and only meaningful relative to each other.
The exposure chart
The exposure chart is your dose history turned into a curve — every logged dose decaying by your medication's half-life, stacking into the level your body carries, with a 21-day forecast ahead:
- Solid line — your modeled level to date, from real logs.
- Dashed line — the forecast if you keep dosing on schedule.
- Shaded band — the steady-state band: the plateau range your current target dose is heading toward.
Your Daily Brief
The Daily Brief is a short, plain-language summary of where your regimen stands today — which medications are active, where each is in its cycle, and what your recent logging looks like. It's written entirely from your own logged data.
It's a readout, not advice: it describes your situation, never tells you what to dose, and never recommends a change. The whole app carries the same line — personal tracking only · not medical advice · does not recommend doses.
Due today, check-ins & quick logging
Below the brief, Today's Schedule lists what's due, each with a one-tap Log button, and Today's Log shows what you've recorded so far. A Check-in pending chip is your nudge to record how you're feeling. Logging from here is the whole daily workflow for most days; the Log screen covers doses, weight, check-ins, and labs in full.